COMPUTER GRAPHICS AND ANIMATION
Computer graphics and animation are interdisciplinary fields that involve creating, manipulating, and displaying visual images and animations using computers. These technologies find applications in various industries, including entertainment, education, design, simulation, and more. Here’s an overview of both computer graphics and animation:
Computer graphics and animation is the creation of visual images using computers. This can be done for a variety of purposes, including:
- Creating still images such as photographs, illustrations, and diagrams
- Creating moving images such as animations and videos
- Creating interactive experiences such as video games and virtual reality simulations
Computer graphics and animation are used in a wide variety of industries, including:
- Film and television
- Video games
- Advertising
- Product design
- Architecture
- Engineering
- Medicine
- Science
There are a number of different techniques used in computer graphics and animation, including:
- 3D modeling is the process of creating a mathematical representation of a three-dimensional object.
- Texturing is the process of adding detail to a 3D model by applying textures, such as images or patterns.
- Rigging is the process of adding bones and joints to a 3D model to make it movable.
- Animation is the process of creating the illusion of movement by displaying a sequence of images in rapid succession.
- Rendering is the process of converting a 3D model into a two-dimensional image.
Computer graphics and animation are a rapidly evolving field, and new techniques are being developed all the time. This is making it possible to create increasingly realistic and immersive visual experiences.
Development of Computer graphics
The development of computer graphics and animation has been a long and fascinating journey, with many groundbreaking advancements over the years. Here’s a brief overview of the key milestones:
Early Experiments (1940s-1950s):
1940s: John Whitney creates the first computer-animated film, “Johnny Strikes Back,” using an analog computer.
1950s: William Fetter coins the term “computer graphics” at Boeing.
Sketchpad and the Dawn of Interactive Graphics (1960s):
- 1963: Ivan Sutherland develops Sketchpad, the first interactive computer graphics system, at MIT.

- 1968: The first computer-animated feature film, “Seema Bagh,” is produced in India.
The Rise of 3D Graphics (1970s-1980s):
1972: Edwin Catmull develops the first 3D subdivision surface algorithm at the University of Utah.
1975: The first fully computer-generated short film, “A Computer Animated Hand,” is produced at the University of Utah.
- 1982: The first commercial 3D computer graphics workstation, the Silicon Graphics IRIS, is released.
The Golden Age of Computer Graphics (1990s-2000s):
- 1993: Steven Spielberg’s film “Jurassic Park” revolutionizes computer graphics with groundbreaking digital dinosaurs.
- 1995: Pixar’s film “Toy Story” becomes the first fully computer-generated feature film.
- 2002: The first GPU (graphics processing unit) is released, significantly increasing the processing power for computer graphics.

Recent Advances and the Future of Computer Graphics:
2010s: Real-time ray tracing becomes increasingly popular, allowing for more realistic lighting and shadows in computer graphics.
2020s: Artificial intelligence is being used to create new techniques for computer graphics, such as neural rendering and generative models.
The future of computer graphics is bright, with continued advancements in technology and new applications emerging all the time. Computer graphics will play an increasingly important role in our lives, from creating immersive entertainment experiences to powering advanced scientific simulations.
Basic graphics and standards
Basic graphics and standards refer to the fundamental principles and guidelines that govern the creation and display of visual content. These principles and guidelines ensure consistency, quality, and compatibility across different devices and platforms.
Key Principles of Basic Graphics
Hierarchy: Arranging elements in a way that guides the viewer’s eye towards the most important information.
Balance: Distributing elements evenly to create a visually stable and harmonious composition.
Alignment: Aligning elements to create a sense of order and organization.
Contrast: Creating visual differences between elements to make them stand out and differentiate them.
Emphasis: Drawing attention to the most important elements using size, color, contrast, or other visual cues.
Proximity: Grouping related elements together to create visual relationships and enhance understanding.
Repetition: Repeating elements to create visual rhythm, unity, and emphasis.
Negative Space: The empty space surrounding elements, which contributes to balance and legibility.
Graphics Standards
Graphics standards are formal specifications that define the technical aspects of creating and displaying graphical content. These standards ensure compatibility across different software applications, operating systems, and devices.
Common Graphics Standards
JPEG (Joint Photographic Experts Group): A widely used standard for compressed raster images, suitable for photographs and other realistic images.
PNG (Portable Network Graphics): A widely used standard for compressed raster images, suitable for web graphics and logos with sharp edges.
GIF (Graphics Interchange Format): A standard for compressed raster images with a limited color palette, suitable for low-resolution graphics and animations.
SVG (Scalable Vector Graphics): A standard for vector graphics, suitable for logos, icons, and illustrations that need to scale to different sizes without losing quality.
HTML5 Canvas: A JavaScript API that allows developers to create dynamic and interactive graphics directly in web browsers.
OpenGL (Open Graphics Library): A cross-platform API for rendering 2D and 3D graphics, commonly used in video games and scientific visualization.
Following basic graphics principles and adhering to relevant graphics standards can significantly enhance the visual quality, consistency, and compatibility of graphical content.
Raster scan and Random scan Graphics
Raster scan and random scan are two fundamental techniques used to display images on cathode-ray tube (CRT) monitors. Both methods involve systematically illuminating individual pixels on the screen to form the desired image.
Raster Scan Graphics
In raster scan graphics, the electron beam systematically scans the screen line by line, starting from the top-left corner and moving horizontally to the right until it reaches the end of the line. Once it reaches the end of a line, the beam quickly jumps back to the left side of the screen and moves down one line to start scanning the next line. This process continues until the entire screen has been scanned.
Advantages of Raster Scan Graphics:
- Simple and efficient implementation
- Well-suited for displaying realistic images with a wide range of colors
Disadvantages of Raster Scan Graphics:
- Limited resolution compared to random scan graphics
- Jagged edges and aliasing can occur, especially for curved lines
Random Scan Graphics
In random scan graphics, the electron beam directly draws the image by selectively illuminating individual pixels. The beam moves directly from one pixel to the next, following the lines and shapes of the image. This method allows for more precise control over the image and can produce smoother lines and curves.
Advantages of Random Scan Graphics:
- Higher resolution compared to raster scan graphics
- Smoother lines and curves, reducing aliasing
Disadvantages of Random Scan Graphics:
- More complex implementation
- Not as efficient for displaying realistic images with a wide range of colors
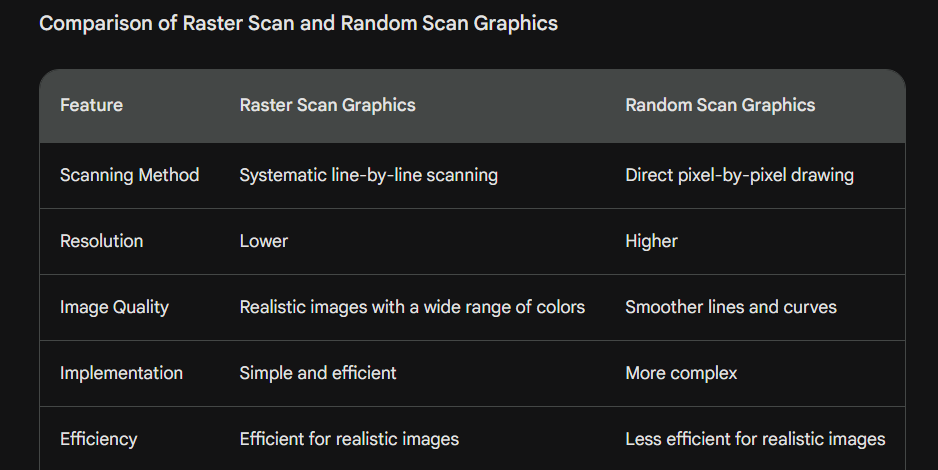
Applications of Raster Scan and Random Scan Graphics
Raster scan graphics is the dominant technology for most modern displays, including televisions, computer monitors, and smartphones. Its simplicity, efficiency, and ability to display realistic images make it well-suited for a wide range of applications.
Random scan graphics is less common but is still used in some specialized applications, such as oscilloscopes and flight simulators. Its higher resolution and smoother lines make it ideal for applications where precise detail and accuracy are critical.
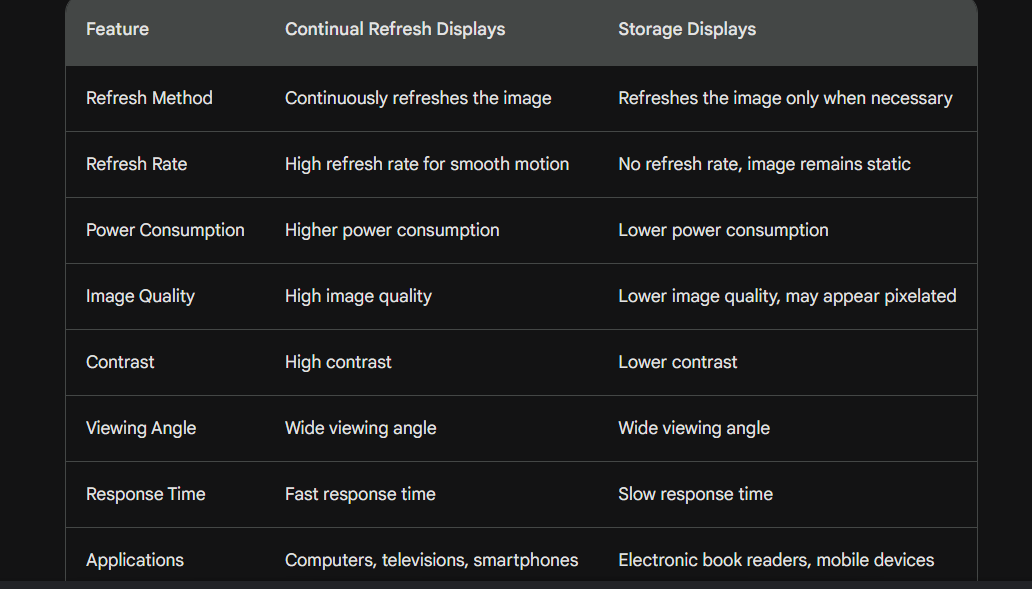
Continual refresh and storages displays
Continual Refresh and Storage Displays
Continual refresh and storage displays are two categories of display technologies that differ in their approach to maintaining and presenting visual information.
Continual Refresh Displays
In continual refresh displays, the image is constantly being redrawn or refreshed on the screen. This is done by repeatedly scanning the screen with an electron beam or other light source and illuminating individual pixels to form the desired image. The refresh rate, measured in frames per second (FPS), determines how often the image is refreshed. A higher refresh rate results in smoother, more fluid motion and reduces the perception of flicker.
Common examples of continual refresh displays include:
Cathode-ray tube (CRT) monitors: CRT monitors were the dominant display technology for many years and are still used in some applications. They use an electron beam to scan the screen and illuminate individual pixels phosphor coating.
Liquid crystal display (LCD) monitors: LCD monitors are widely used in modern computers, televisions, and smartphones. They use liquid crystal cells to control the passage of light through a backlight, creating the desired image.
OLED (organic light-emitting diode) displays: OLED displays are a newer technology that offers higher contrast, wider viewing angles, and faster response times compared to LCD displays. Each pixel in an OLED display is an individual light source, allowing for precise control over the image.
Storage Displays
In storage displays, the image is stored in a memory buffer and is only refreshed when necessary. This means that the image on the screen remains static until there is a change in the image data. Storage displays are typically used in applications where low power consumption is critical, such as electronic book readers and mobile devices.
Common examples of storage displays include:
E Ink displays: E Ink displays use microcapsules containing tiny charged particles suspended in a fluid. By applying an electric field, the particles can be moved to form the desired image. E Ink displays are known for their high contrast, low power consumption, and readability in direct sunlight.
Memory LCD (MLCD) displays: MLCD displays combine the features of LCD and storage displays. They use a bistable LCD panel that retains its state even when power is not applied. This allows for low power consumption while maintaining a static image.
Comparison of Continual Refresh and Storage Displays
Display processors and character generations
Display Processors
A display processor is an integrated circuit (IC) that is responsible for processing and displaying images on a digital display. It is responsible for a variety of tasks, including:
- Image processing: This includes tasks such as scaling, rotating, and color correction.
- Memory management: The display processor must manage the flow of data from the system memory to the display controller.
- Display control: The display processor controls the timing and sequencing of the data that is sent to the display controller.
- Interface: The display processor must provide an interface to the system bus and the display controller.
There are two main types of display processors:
- Integrated display processors (IDPs): IDPs are integrated into the motherboard of a computer. They are typically used for lower-end displays.
- Dedicated display processors (DDPs): DDPs are separate ICs that are connected to the motherboard via a PCIe or other high-speed interface. They are typically used for high-end displays that require more processing power.
Character Generations
Character generation (CG) is the process of creating and displaying characters on a digital display. CG was originally developed for cathode-ray tube (CRT) monitors, but it is now used for a variety of displays, including LCD monitors, OLED displays, and projectors.
There are two main types of CG:
- Raster character generation: In raster CG, characters are created by drawing them directly onto the screen using a bitmap. This method is fast and efficient, but it can produce jagged edges and aliasing.
- Vector character generation: In vector CG, characters are created using mathematical formulas. This method produces smoother edges and no aliasing, but it is more computationally expensive.
CG is used in a variety of applications, including:
- Computers: CG is used to display text, icons, and other graphical elements on computer screens.
- Video games: CG is used to display characters, scenery, and other objects in video games.
- Digital signage: CG is used to display text, graphics, and videos on digital signage displays.
Relationship between Display Processors and Character Generations
Display processors and character generators are closely related. The display processor is responsible for processing the data that is generated by the character generator and sending it to the display controller. The character generator is responsible for generating the data that is needed to display characters on the screen.
Color Display Techniques
Color display techniques are methods used to generate and display colors on electronic devices. These techniques are essential for creating realistic and visually appealing images and graphics. There are two main types of color display techniques: additive and subtractive.
Additive color
Additive color is based on the principle that colors are created by mixing light of different wavelengths. The three primary colors of light are red, green, and blue (RGB). When these colors are combined in different proportions, they can create a wide range of colors. For example, mixing equal amounts of red and green light produces yellow, while mixing equal amounts of red and blue light produces magenta.
Additive color is used in cathode-ray tube (CRT) monitors, liquid crystal displays (LCDs), and other electronic devices that emit light. In these devices, each pixel on the screen is made up of three subpixels, one for each primary color. The intensity of each subpixel can be controlled to create the desired color for that pixel.
Subtractive color
Subtractive color is based on the principle that colors are created by absorbing certain wavelengths of light. The three primary colors of pigment are cyan, magenta, and yellow (CMY). When these pigments are mixed in different proportions, they can absorb different wavelengths of light, creating a wide range of colors. For example, mixing equal amounts of cyan and magenta pigment absorbs red light, producing green.
Subtractive color is used in printing and in some types of electronic displays, such as electrophoretic displays (EPDs). In these displays, each pixel on the screen is made up of a layer of colored pigment. The amount of light that is reflected from each pixel can be controlled by applying an electric field to the pigment layer.
Color models
Color models are mathematical representations of the way that colors are perceived by the human eye. They are used to define the colors that can be displayed on electronic devices and to convert between different color spaces. There are many different color models, but some of the most common are:
RGB (red, green, blue): This is the most common color model for additive color displays. It is based on the three primary colors of light: red, green, and blue.
CMYK (cyan, magenta, yellow, black): This is the most common color model for subtractive color printing. It is based on the three primary colors of pigment: cyan, magenta, and yellow. Black is added to the CMYK model to create a wider range of colors.
HSV (hue, saturation, value): This is a perceptual color model that is based on how humans perceive color. Hue is the color itself, such as red, green, or blue. Saturation is the intensity of the color, and value is the brightness of the color.
LAB (lightness, a, b): This is another perceptual color model that is based on how humans perceive color. Lightness is the brightness of the color, a is the redness or greenness of the color, and b is the yellowness or blueness of the color.
Color models are used in a variety of applications, including:
Graphics software: Graphics software uses color models to define the colors of images and graphics.
Web browsers: Web browsers use color models to display colors on web pages.
Digital cameras: Digital cameras use color models to capture and store color information.
Printers: Printers use color models to convert digital color information into colors that can be printed on paper.
Frame buffer and Bit Operations concepts in raster graphics
Here is the Python code for drawing lines on a framebuffer using bit operations:
import numpy as np
# Define the framebuffer size
width = 640
height = 480
# Create a framebuffer with a black background
framebuffer = np.zeros((height, width, 3), dtype=np.uint8)
# Define a function to draw a line on the framebuffer using bit operations
def draw_line_bitwise(x1, y1, x2, y2, color):
# Set the starting and ending points of the line
x = x1
y = y1
# Calculate the increments for each pixel along the line
dx = (x2 – x1) // abs(x2 – x1)
dy = (y2 – y1) // abs(y2 – y1)
# Draw the line using bit operations
while x != x2 or y != y2:
# Set the pixel color
framebuffer[y, x] = color
# Update the position of the pixel
x += dx
y += dy
# Draw a red line from (100, 100) to (200, 200)
draw_line_bitwise(100, 100, 200, 200, (255, 0, 0))
# Draw a green line from (200, 100) to (300, 300)
draw_line_bitwise(200, 100, 300, 300, (0, 255, 0))
# Draw a blue line from (300, 100) to (400, 200)
draw_line_bitwise(300, 100, 400, 200, (0, 0, 255))
# Display the framebuffer
import matplotlib.pyplot as plt
plt.imshow(framebuffer)
plt.show()
This code creates the following graph:

Unit -2 Drawing Techniques
Drawing techniques are methods and tools used to create visual representations on a surface. These techniques range from simple mark-making with pens and pencils to complex digital manipulation of images. The choice of technique depends on the desired outcome, the artist’s skill level, and the available materials.
Basic Drawing Techniques
Line Drawing: The foundation of drawing, line drawing involves creating lines with varying thickness and pressure to define forms and create textures.
Shading: Shading is used to add depth and dimension to a drawing by creating tonal variations. This can be achieved using pencils, shading tools, or digital techniques.
Hatching and Cross-Hatching: Hatching involves creating parallel lines to create shadows or textures, while cross-hatching involves intersecting hatching lines for darker tones.
Stippling: Stippling involves creating a pattern of dots to create tones and textures. This technique is often used in pointillism, a style of drawing that relies on the accumulation of small dots to create an image.
Blending: Blending involves smoothing out transitions between tones and creating soft edges. This can be achieved using blending tools, such as tortillons or stumps, or digital techniques.
Contour Drawing: Contour drawing involves focusing on the outlines of an object, capturing its shape and form.
Gesture Drawing: Gesture drawing involves capturing the movement and essence of a subject using quick, expressive strokes.
Advanced Drawing Techniques
Perspective: Perspective is a technique used to create the illusion of depth on a flat surface. This involves understanding how objects appear to change size and shape as they recede into the distance.
Foreshortening: Foreshortening is a technique used to depict objects as they would appear when viewed from an angle, such as a hand extended towards the viewer.
Proportion: Proportion is the relationship between the sizes of different parts of a drawing or between the drawing and the subject.
Composition: Composition is the arrangement of elements within a drawing to create a visually appealing and balanced image.
Value: Value refers to the lightness or darkness of a color. Using value effectively can create a sense of depth, contrast, and atmosphere.
Texture: Texture is the visual or tactile quality of a surface. Understanding and portraying texture can add realism and interest to a drawing.
Medium Exploration: Experimenting with different drawing mediums, such as charcoal, pastels, inks, and digital tools, can expand an artist’s expressive capabilities.
Drawing techniques are constantly evolving as artists explore new materials, technologies, and approaches to visual representation.
Point:
In geometry, a point is a fundamental object that has no length, width, or thickness. It is a dimensionless position in space, often represented by a dot. Points are the building blocks of other geometric shapes, such as lines, curves, and planes.
Properties of Points
Dimensionality: Points are considered to be zero-dimensional, meaning they have no length, width, or height.
Position: Points are defined by their position in space, often represented by coordinates.
Indivisibility: Points are indivisible, meaning they cannot be further divided into smaller parts.
Uniqueness: Each point has a unique position, making it distinct from other points.
Mark-making: Points are often represented by a dot or other mark on a surface.
Applications of Points
Geometry: Points are the fundamental elements of geometry, used to define shapes, lines, and planes.
Physics: Points are used to represent positions of objects in space and time.
Computer Graphics: Points are used to represent pixels on screens and form the basis of digital images.
Data Visualization: Points are used to represent data points in charts and graphs.
Navigation: Points are used to represent locations on maps and in navigation systems.
Points are fundamental concepts in mathematics and have wide-ranging applications in various fields. Their simplicity and ubiquity make them essential tools for understanding and representing the physical world.
lines and curves
In geometry, lines and curves are two fundamental types of geometric shapes that differ in their properties and characteristics.
Lines
A line is a straight path that extends infinitely in both directions. It has no width or thickness and is defined by two distinct points called endpoints. Lines are considered to be one-dimensional objects.
Properties of Lines
Straightness: Lines maintain a constant direction throughout their length.
Infinite length: Lines extend infinitely in both directions.
Unlimited number of points: A line contains an infinite number of points.
Zero thickness: Lines have no width or thickness.
Applications of Lines
Geometry: Lines are fundamental elements of geometry, used to construct shapes and define relationships between points.
Physics: Lines are used to represent paths of motion, trajectories, and relationships between physical quantities.
Engineering: Lines are used in blueprints, diagrams, and designs to represent structures and components.
Computer Graphics: Lines are used to form the basis of vector graphics and create digital drawings.
Curves
A curve is a path that continuously changes direction. It has no sharp angles or corners and is defined by a set of points called control points. Curves are considered to be one-dimensional objects.
Properties of Curves
Continuous change of direction: Curves continuously change direction throughout their length.
Smoothness: Curves have no sharp angles or corners and maintain a smooth flow.
Finite or infinite length: Curves can have finite or infinite lengths.
Varied thickness: Curves can have varying thicknesses, depending on the specific type of curve.
Applications of Curves
Geometry: Curves are used to represent natural shapes, such as parabolas, ellipses, and hyperbolas.
Design: Curves are used to create aesthetically pleasing and organic forms in various design fields.
Physics: Curves are used to represent trajectories of objects under different forces, such as the parabolic path of a projectile.
Animation: Curves are used to create smooth and realistic movements in animation and motion graphics.
Computer Graphics: Curves are used to form the basis of Bézier curves and other types of spline interpolation, creating smooth and organic shapes in digital graphics.
Lines and curves are essential concepts in mathematics and have a wide range of applications in various fields. Their properties and characteristics make them valuable tools for understanding and representing the physical world.
Scan conversion
import numpy as np
# Define the framebuffer size
width = 640
height = 480
# Create a framebuffer with a black background
framebuffer = np.zeros((height, width, 3), dtype=np.uint8)
def bresenham_line(x1, y1, x2, y2, color):
dx = abs(x2 – x1)
dy = abs(y2 – y1)
# Determine the increment for each pixel along the line
sx = 1 if x2 >= x1 else -1
sy = 1 if y2 >= y1 else -1
# Initialize error term
e = 2 * dy – dx
# Start at the initial point
x = x1
y = y1
# Draw the line using Bresenham’s algorithm
while x != x2 or y != y2:
# Set the pixel color
framebuffer[y, x] = color
# Update the error term
if e >= 0:
y += sy
e -= 2 * dx
else:
x += sx
e += 2 * dy
# Draw a red line from (100, 100) to (200, 200)
bresenham_line(100, 100, 200, 200, (255, 0, 0))
# Draw a green line from (200, 100) to (300, 300)
bresenham_line(200, 100, 300, 300, (0, 255, 0))
# Draw a blue line from (300, 100) to (400, 200)
bresenham_line(300, 100, 400, 200, (0, 0, 255))
# Display the framebuffer
import matplotlib.pyplot as plt
plt.imshow(framebuffer)
plt.show()

line drawing algorithms
Line drawing algorithms are computational methods used to approximate the representation of a line segment on a discrete graphical display, such as a computer screen or printer. These algorithms are essential for rasterization, the process of converting vector graphics into a raster format for display.
Common Line Drawing Algorithms
DDA (Digital Differential Analyzer): The DDA algorithm is a simple and straightforward method that iteratively calculates the coordinates of each pixel along the line segment. It is based on the principle of incremental steps, where the change in x and y coordinates are calculated for each pixel.
Bresenham’s Line Algorithm: Bresenham’s algorithm is a more efficient and widely used line drawing algorithm that exploits the properties of integers to minimize computations. It employs an error term that determines whether to increment the x or y coordinate at each step, resulting in faster and more accurate line rendering.
Midpoint Algorithm: The midpoint algorithm is another efficient line drawing algorithm that utilizes the concept of the midpoint of a line segment. It recursively divides the line segment into smaller halves until the desired resolution is reached, ensuring smooth and accurate line rendering.
Factors Affecting Line Drawing Algorithms
Line Slope: The slope of a line, which represents its steepness, influences the algorithm’s efficiency and accuracy. Steep slopes may require more calculations due to the need for smaller increments.
Anti-Aliasing: Anti-aliasing techniques are employed to reduce the jagged appearance of lines caused by the discrete nature of raster displays. These techniques, such as supersampling and filtering, smooth out edges and create more realistic-looking lines.
Clipping: Clipping is the process of ensuring that lines remain within the boundaries of the display area. This prevents lines from extending beyond the edges of the screen or printer, resulting in a more visually pleasing output.
Applications of Line Drawing Algorithms
Line drawing algorithms have a wide range of applications in computer graphics and visualization:
Wireframe Models: Line drawing algorithms are used to render the wireframe representations of 3D objects, providing a skeletal framework for understanding their form.
Computer-Aided Design (CAD): In CAD software, line drawing algorithms are used to create precise and accurate line drawings of technical designs and blueprints.
Interactive Graphics: Line drawing algorithms are employed in interactive graphics applications to draw lines in real-time, enabling user interaction and manipulation of graphical elements.
Image Processing: Line detection and extraction are important tasks in image processing, where line drawing algorithms are used to identify and trace lines within images.
Vector Graphics Rendering: Line drawing algorithms are used to render vector graphics, which are composed of lines and other geometric shapes, into raster formats for display.
Line drawing algorithms are fundamental tools in computer graphics, providing the foundation for representing and rendering lines on various display devices. Their efficiency, accuracy, and adaptability make them essential for a wide range of applications, from wireframe modeling to interactive graphics.
Circle and Ellipse Generation
Circle Generation Algorithms
Circles are fundamental shapes in geometry and computer graphics. Their smooth, continuous curves require precise calculation methods to accurately represent them on discrete display devices. Several algorithms have been developed for generating circles in raster graphics:
Midpoint Circle Algorithm: The midpoint circle algorithm is a widely used and efficient method for drawing circles. It utilizes the concept of the midpoint of a circle’s quadrant to determine which pixels to set along the circle’s perimeter. By iteratively calculating the midpoint of each quadrant, the algorithm traces out the circle’s outline with accuracy.
DDA (Digital Differential Analyzer): The DDA algorithm can also be applied to generate circles. It iteratively calculates the coordinates of each pixel along the circle’s circumference using incremental steps. While less efficient than the midpoint circle algorithm, DDA provides a straightforward approach to circle generation.
Bresenham’s Circle Algorithm: Bresenham’s circle algorithm is an extension of Bresenham’s line algorithm, specifically designed for circle generation. It exploits the properties of integers to minimize computations and efficiently trace out the circle’s outline.
Ellipse Generation Algorithms
Ellipses are oval-shaped curves that extend beyond circles, introducing a second axis of symmetry. Their generation involves scaling and stretching a circle, requiring modifications to circle generation algorithms. Common ellipse generation algorithms include:
Scaled Midpoint Circle Algorithm: The scaled midpoint circle algorithm extends the midpoint circle algorithm to ellipses by scaling the x and y coordinates separately based on the ellipse’s aspect ratio. This method accurately generates ellipses with smooth and continuous curves.
Polar Coordinates Method: The polar coordinates method utilizes the mathematical representation of ellipses in polar coordinates. By converting angles to x and y coordinates, the algorithm traces out the ellipse’s perimeter.
Parametric Equation Method: The parametric equation method uses parametric equations to represent ellipses. By evaluating these equations at various angles, the algorithm generates points along the ellipse’s curve.
Factors Affecting Circle and Ellipse Generation
Resolution: The resolution of the display device affects the precision of circle and ellipse rendering. Higher resolutions allow for smoother and more detailed curves.
Anti-Aliasing: Anti-aliasing techniques reduce the jagged appearance of curves caused by discrete display pixels. These techniques, such as supersampling and filtering, create smoother transitions and more realistic-looking circles and ellipses.
Clipping: Clipping ensures that circles and ellipses remain within the display boundaries. This prevents them from extending beyond the edges of the screen or printer.
Applications of Circle and Ellipse Generation Algorithms
Circle and ellipse generation algorithms have a wide range of applications in computer graphics and visualization:
Object Representation: Circles and ellipses are used to represent a variety of objects, such as wheels, planets, and eyes, in computer graphics.
Graphical User Interfaces (GUIs): Ellipse-based icons and buttons are commonly used in GUIs to provide a visually appealing and intuitive interface.
Medical Imaging: Circles and ellipses are employed in medical imaging to identify and analyze circular structures, such as cells or blood vessels.
Scientific Visualization: Circle and ellipse generation algorithms are used to visualize data in various scientific fields, such as astronomy and physics.
Animation: Circles and ellipses are used to create smooth and realistic movements in animations, such as bouncing balls or rotating planets.
Polygon filling
Polygon filling is a fundamental technique in computer graphics that involves determining the pixels within the boundaries of a polygon and setting their colors accordingly. It is essential for rendering complex shapes and creating realistic images. Several algorithms have been developed for filling polygons efficiently and accurately.
Common Polygon Filling Algorithms
Scanline Algorithm: The scanline algorithm is a widely used and versatile method for filling polygons. It horizontally scans the display area, analyzing the intersection of each scanline with the polygon’s edges. For each pixel along the scanline, the algorithm determines whether it lies inside the polygon and fills it with the appropriate color.
Seed-Filling Algorithm: The seed-filling algorithm is another efficient method for filling polygons, particularly for simple shapes with no holes. It starts with a seed point, a pixel known to be inside the polygon, and expands outward, filling adjacent pixels of the same color until the entire polygon is filled.
Boundary-Fill Algorithm: The boundary-fill algorithm is similar to the seed-filling algorithm but uses the polygon’s boundary lines as a starting point. It follows the boundary lines, filling pixels within the polygon until it encounters an already filled pixel or a boundary pixel that leads outside the polygon.
Factors Affecting Polygon Filling Algorithms
Polygon Complexity: The complexity of the polygon, including the number of edges and holes, affects the algorithm’s efficiency. More complex polygons require more computations to determine their interior pixels.
Anti-Aliasing: Anti-aliasing techniques can be applied to reduce the jagged appearance of polygon edges, especially when filling polygons with patterns or textures. These techniques smooth out edges and create more realistic-looking polygons.
Clipping: Clipping ensures that polygons remain within the display boundaries. This prevents them from extending beyond the edges of the screen or printer, avoiding visual artifacts.
Applications of Polygon Filling Algorithms
Polygon filling algorithms have a wide range of applications in computer graphics and visualization:
Object Representation: Polygons are used to represent a variety of objects, such as buildings, landscapes, and characters, in computer graphics.
Image Processing: Polygon filling algorithms are employed in image processing to identify and fill regions of interest within images, such as object segmentation.
Computer-Aided Design (CAD): In CAD software, polygon filling algorithms are used to create solid-colored shapes and patterns in technical drawings.
Interactive Graphics: Polygon filling algorithms are used to fill polygons in real-time in interactive graphics applications, enabling dynamic and user-interactive graphics.
3D Graphics: Polygon filling is a fundamental step in rendering 3D objects, where it fills the projected polygons onto the 2D display screen.
Polygon filling algorithms play a crucial role in computer graphics, providing the foundation for rendering complex shapes and creating realistic images. Their efficiency, adaptability, and wide range of applications make them essential tools for various graphic applications.
Conic –Section Generation
Conic Sections
Conic sections are a family of curves that arise from intersecting a plane with a cone. They include circles, ellipses, parabolas, and hyperbolas. Conic sections are fundamental shapes in geometry and have a wide range of applications in mathematics, physics, engineering, and computer graphics.
Conic-Section Generation Algorithms
Generating conic sections on discrete display devices requires algorithms that can accurately represent their curves and handle their various properties. Several algorithms have been developed for generating conic sections in computer graphics:
Midpoint Conic Algorithm: The midpoint conic algorithm is a versatile method for generating circles, ellipses, parabolas, and hyperbolas. It extends the concept of the midpoint circle algorithm to conic sections, utilizing the midpoint of each conic section’s quadrant to determine which pixels to set along the curve.
Parametric Equation Method: The parametric equation method uses parametric equations to represent conic sections. By evaluating these equations at various angles, the algorithm generates points along the conic section’s curve. This method is particularly useful for generating smooth and continuous curves.
DDA (Digital Differential Analyzer): The DDA algorithm can also be applied to generate conic sections. It iteratively calculates the coordinates of each pixel along the conic section’s circumference using incremental steps. While less efficient than the midpoint conic algorithm, DDA provides a straightforward approach to conic section generation.
Factors Affecting Conic-Section Generation
Type of Conic Section: The type of conic section, such as circle, ellipse, parabola, or hyperbola, affects the algorithm’s complexity. Circles and ellipses are generally easier to generate than parabolas and hyperbolas due to their symmetrical nature.
Resolution: The resolution of the display device affects the precision of conic section rendering. Higher resolutions allow for smoother and more detailed curves.
Anti-Aliasing: Anti-aliasing techniques reduce the jagged appearance of curves caused by discrete display pixels. These techniques, such as supersampling and filtering, create smoother transitions and more realistic-looking conic sections.
Clipping: Clipping ensures that conic sections remain within the display boundaries. This prevents them from extending beyond the edges of the screen or printer.
Applications of Conic-Section Generation Algorithms
Conic-section generation algorithms have a wide range of applications in computer graphics and visualization:
Object Representation: Conic sections are used to represent a variety of objects, such as planetary orbits, parabolic reflectors, and hyperbolic lens shapes, in computer graphics.
Computer-Aided Design (CAD): In CAD software, conic section generation algorithms are used to create smooth and accurate curves for technical drawings and blueprints.
Motion Graphics: Conic sections are employed to create dynamic and realistic motion graphics, such as bouncing balls or planetary trajectories.
Image Processing: Conic section detection and extraction are important tasks in image processing, where these algorithms are used to identify and analyze conic sections within images, such as elliptical cells or parabolic structures.
Scientific Visualization: Conic section generation algorithms are used to visualize data in various scientific fields, such as astronomy and physics, where ellipses represent planetary orbits and parabolas represent projectile paths.
Conic-section generation algorithms are essential tools in computer graphics, providing the foundation for rendering conic sections with accuracy and precision. Their versatility, adaptability, and wide range of applications make them crucial for various graphic applications.
Ant aliasing
Anti-aliasing is a technique used to smooth the jagged edges of lines and curves on a digital display. It is essential for creating realistic and visually appealing images.
Causes of Jagged Edges
Jagged edges, also known as aliasing, occur because digital displays are composed of discrete pixels. These pixels can only represent a limited number of colors, and when lines or curves are too thin or diagonal, they may not align perfectly with the pixel grid. This results in a stair-stepping effect, creating jagged and unnatural-looking edges.
Anti-Aliasing Techniques
Anti-aliasing techniques address this issue by blending or averaging colors to create the illusion of smoother transitions. Several anti-aliasing methods have been developed, each with its own strengths and limitations:
Full Sample Anti-Aliasing (FSAA): FSAA renders the image at a higher resolution and then downsamples it to the display’s resolution. This effectively reduces the aliasing effect by averaging the colors of multiple pixels.
Multisample Anti-Aliasing (MSAA): MSAA renders the image multiple times, slightly offsetting the sampling pattern each time. The results are then combined to create a smoother overall image.
Supersampling: Supersampling renders the image at a higher resolution and then applies a filter to smooth out the edges. This method is more computationally expensive than FSAA or MSAA but can produce higher quality results.
Temporal Anti-Aliasing (TAA): TAA utilizes information from previous frames to smooth out edges, reducing the need for heavy computations. It is particularly effective for objects in motion.
Applications of Anti-Aliasing
Anti-aliasing is widely used in various applications, including:
Computer Graphics: Anti-aliasing is essential for creating realistic and high-quality images in computer graphics, especially in applications like 3D modeling, animation, and video games.
Text Rendering: Anti-aliasing is commonly used to smooth out the edges of text fonts, making them more readable and visually appealing on digital displays.
Image Processing: Anti-aliasing techniques can be applied to improve the quality of digital images, reducing aliasing artifacts and enhancing visual clarity.
Video Editing: Anti-aliasing is often used in video editing software to smooth out the edges of objects and transitions, creating a more polished and professional-looking video.
Real-Time Graphics: Anti-aliasing techniques have become increasingly efficient, allowing for real-time rendering of smooth and high-quality graphics in applications like video games and virtual reality.
Anti-aliasing plays a crucial role in modern digital displays, enabling the creation of realistic, visually appealing, and high-quality images for various applications. As technology advances, anti-aliasing techniques continue to evolve, providing more efficient and effective methods for smoothing out jagged edges and enhancing the overall visual experience.
UNIT: 3
Two– dimensional
Two-dimensional (2D) refers to objects or representations that have two dimensions: length and width. They lack depth or thickness, and they exist only on a flat plane. 2D objects and concepts are fundamental in various fields, including mathematics, geometry, art, and computer graphics.
Examples of Two-Dimensional Objects
Shapes: Basic shapes like circles, squares, triangles, and rectangles are all two-dimensional.
Images: Photographs, drawings, and paintings are examples of two-dimensional images.
Maps: Maps are two-dimensional representations of real-world areas, showing their layout and features.
Wireframe Models: Wireframe models are 3D objects represented in two dimensions, showing their edges and structure.
Applications of Two-Dimensional Concepts
Geometry: 2D geometry studies the properties, relationships, and measurements of two-dimensional shapes.
Computer Graphics: 2D graphics are used in various applications, including image processing, user interfaces, and animation.
Design: 2D design principles are used in graphic design, web design, and product design to create visually appealing and effective layouts.
Art and Illustration: 2D art encompasses various forms of expression, including painting, drawing, and digital art, using two-dimensional shapes and forms.
Properties of Two-Dimensional Objects
Flatness: 2D objects exist on a flat plane and lack depth or thickness.
Dimensions: They are defined by two dimensions: length and width.
Area: 2D objects have a measurable area, which is the extent of their surface.
Perimeter: 2D objects have a measurable perimeter, which is the total length of their boundary.
Representation: 2D objects can be represented using various methods, including drawings, diagrams, and mathematical equations.
Two-dimensional concepts and objects play a fundamental role in various fields, providing a simplified yet effective framework for representing and analyzing shapes, images, and spatial relationships. Their versatility and applicability make them essential tools in various disciplines.
Two- dimensional viewing
Two-dimensional viewing is a fundamental concept in computer graphics that involves projecting three-dimensional objects onto a two-dimensional display screen. It is the process of transforming the coordinates of 3D objects into pixel coordinates on a 2D display device.
Pipeline of Two-Dimensional Viewing
Modeling Transformation: The modeling transformation defines the position, orientation, and scale of the 3D object in the world coordinate system.
Viewing Transformation: The viewing transformation establishes the viewpoint from which the object is observed. It translates, rotates, and scales the object to align with the viewer’s perspective.
Projection Transformation: The projection transformation maps the 3D object onto a two-dimensional plane, such as the display screen. It converts the 3D coordinates into 2D coordinates that can be displayed on the screen.
Viewport Transformation: The viewport transformation maps the projected 2D coordinates onto the specific area of the display screen. It scales and translates the coordinates to fit within the viewport rectangle.
Rasterization: Rasterization converts the 2D coordinates into pixel coordinates, determining which pixels on the screen should be filled with the corresponding color of the object’s surface.
Clipping
Clipping is the process of removing parts of the 3D object that are outside the viewing frustum or the viewport, preventing them from being rendered on the screen. Clipping ensures that only visible portions of the object are displayed, avoiding unnecessary computations and visual artifacts.
Backface Culling
Backface culling is an optimization technique that eliminates the need to render the back faces of polygons, which are not visible to the viewer. This reduces the computational load and improves rendering efficiency.
Hidden Surface Removal
Hidden surface removal is the process of determining which surfaces of an object are visible and which are hidden, preventing the rendering of hidden surfaces. This technique enhances image realism and reduces redundancy in rendering.
Applications of Two-Dimensional Viewing
Two-dimensional viewing is essential for a wide range of applications in computer graphics, including:
Visualization: Two-dimensional viewing is the foundation for visualizing 3D objects in various applications, such as 3D modeling software, video games, and virtual reality.
Computer-Aided Design (CAD): Two-dimensional viewing is used in CAD software to create blueprints, drawings, and models of objects in a two-dimensional representation.
Medical Imaging: Two-dimensional viewing is used to display and analyze medical images, such as X-rays, CT scans, and MRIs.
Image Processing: Two-dimensional viewing is used in image processing to manipulate and enhance images, such as filtering, edge detection, and segmentation.
Graphical User Interfaces (GUIs): Two-dimensional viewing is used to create the visual elements of GUIs, including icons, buttons, menus, and windows.
Two-dimensional viewing is a fundamental tool in computer graphics, providing the foundation for representing, transforming, and displaying 3D objects on two-dimensional display devices. Its versatility and applicability make it essential for a wide range of graphic applications.
Basic Transformations
import numpy as np
# Define the framebuffer size
width = 640
height = 480
# Create a framebuffer with a white background
framebuffer = np.ones((height, width, 3), dtype=np.uint8) * 255
# Define the center of the object
center_x = width // 2
center_y = height // 2
# Define the radius of the object
radius = 100
# Define the color of the object
color = (255, 0, 0)
# Translation
def translate(x, y, dx, dy):
return x + dx, y + dy
# Translation example
translated_x, translated_y = translate(center_x, center_y, 50, 50)
# Draw a circle at the translated coordinates
for x in range(width):
for y in range(height):
distance = np.sqrt((x – translated_x)**2 + (y – translated_y)**2)
if distance <= radius:
framebuffer[y, x] = color
# Display the framebuffer
import matplotlib.pyplot as plt
plt.imshow(framebuffer)
plt.show()
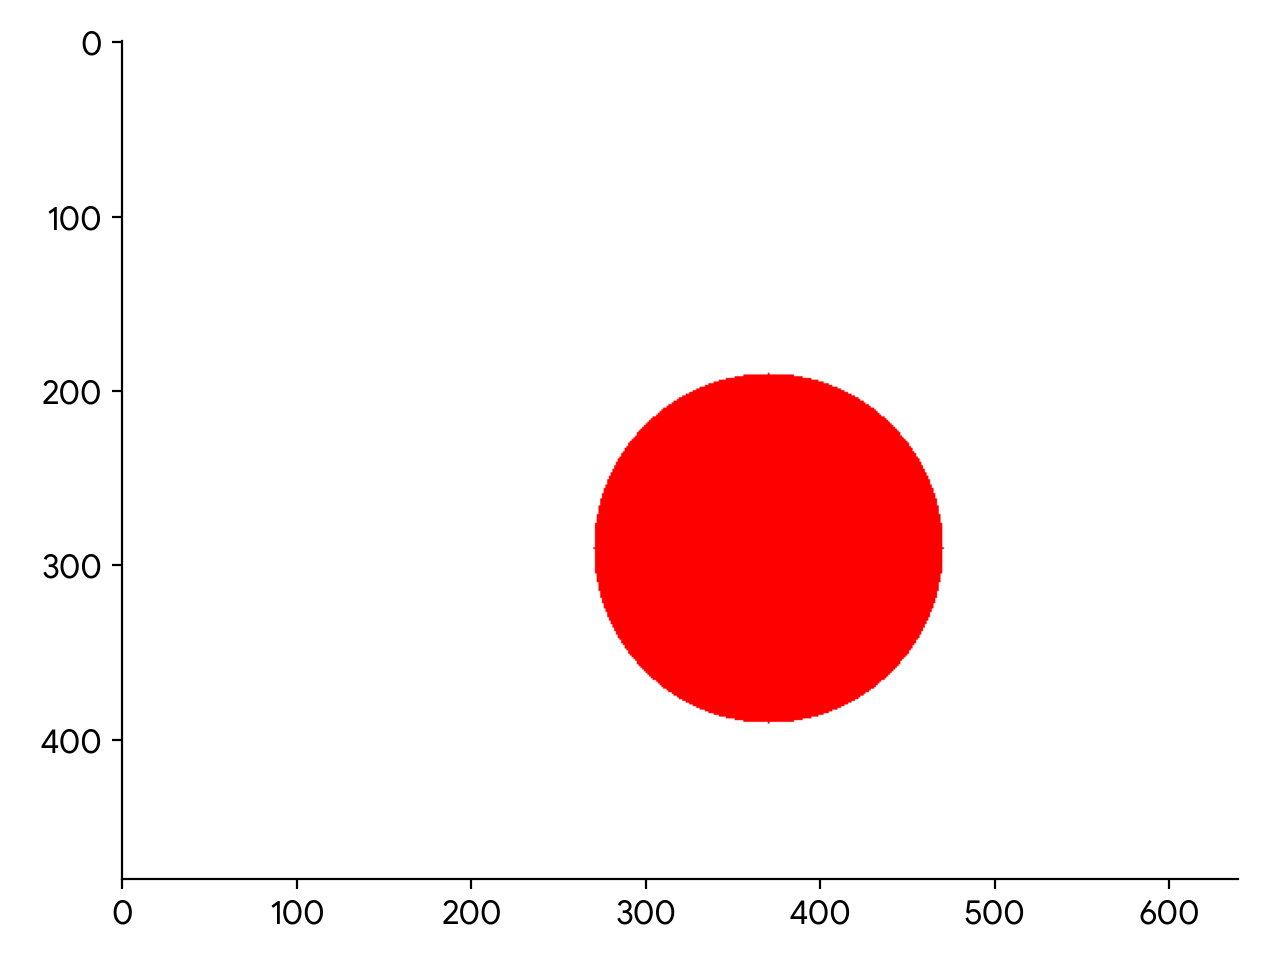
This code creates the following graph:
Coordinate system
A coordinate system is a reference frame used to represent and measure the position of points and objects in space. It provides a framework for describing spatial relationships and performing mathematical operations. Coordinate systems are fundamental in various fields, including mathematics, physics, engineering, and computer graphics.
Types of Coordinate Systems
Cartesian Coordinate System: The most common type of coordinate system, the Cartesian coordinate system, uses two perpendicular axes to represent positions in two-dimensional space. The axes are labeled as the x-axis and y-axis, and their intersection point is called the origin. Each point in the plane is identified by its coordinates, which are ordered pairs of numbers representing its distance from the origin along the x-axis and y-axis.
Polar Coordinate System: The polar coordinate system represents points in two-dimensional space using a distance from a fixed point (origin) and an angle from a fixed reference line (polar axis). The distance is called the radius, and the angle is called the polar angle or theta.
Spherical Coordinate System: The spherical coordinate system extends the polar coordinate system to three-dimensional space. It uses three coordinates: radial distance from the origin, polar angle, and azimuthal angle. The azimuthal angle represents the rotation around the polar axis.
Cylindrical Coordinate System: Another extension of the polar coordinate system, the cylindrical coordinate system, uses three coordinates: radial distance from the origin, polar angle, and height along a fixed axis.
Properties of Coordinate Systems
Dimensions: Coordinate systems can be one-dimensional, two-dimensional, or three-dimensional, depending on the number of axes or parameters used to represent positions.
Origin: The origin is the reference point from which distances and angles are measured. It is often represented by the intersection of the coordinate axes.
Units: Coordinate systems have units of measurement, such as meters, centimeters, or degrees, which determine the scale of the representation.
Transformations: Coordinate systems can be transformed to represent different viewpoints or orientations. This is important for representing objects in different positions or from different perspectives.
Applications of Coordinate Systems
Mathematics: Coordinate systems are fundamental in mathematics for defining and analyzing geometric shapes, solving equations, and understanding spatial relationships.
Physics: Coordinate systems are used in physics to describe the motion of objects, represent forces, and model physical phenomena.
Engineering: Coordinate systems are essential in engineering for designing structures, analyzing stresses, and creating blueprints and schematics.
Computer Graphics: Coordinate systems are used in computer graphics to represent 3D objects, perform transformations, and render images on a two-dimensional screen.
Navigation: Coordinate systems, such as latitude and longitude, are used in navigation to determine the location of objects on Earth.
Coordinate systems are indispensable tools for understanding and representing spatial relationships, providing a common language for describing positions and performing calculations in various fields. Their versatility and adaptability make them essential for a wide range of applications.
Windowing and Clipping
Windowing and clipping are fundamental techniques in computer graphics used to manage the viewing area and optimize rendering efficiency. They work together to ensure that only the visible portions of a scene are rendered, reducing computational overhead and improving image quality.
Windowing
Windowing defines a rectangular region on the display screen that represents the visible area of the scene. It acts as a viewport, specifying the portion of the world coordinates that will be mapped onto the display screen. Windowing is particularly useful for large scenes where only a specific region of interest needs to be displayed.
Clipping
Clipping is the process of removing parts of objects that fall outside the windowing region. It ensures that only the visible portions of objects are rendered, preventing them from extending beyond the display boundaries. Clipping improves rendering efficiency by avoiding unnecessary calculations for invisible portions of the scene.
Types of Clipping Algorithms
Several algorithms have been developed for efficient clipping of objects against windowing regions:
Cohen-Sutherland Algorithm: A widely used algorithm that iteratively checks the intersection of a line segment with the windowing boundaries.
Liang-Barsky Algorithm: An optimization of the Cohen-Sutherland algorithm, reducing the number of intersection tests.
Sutherland-Hodgman Algorithm: An extension of the Cohen-Sutherland algorithm to handle polygons with holes.
Weiler-Atherton Algorithm: A more efficient algorithm for clipping polygons, particularly for complex shapes with multiple edges.
Applications of Windowing and Clipping
Windowing and clipping are essential techniques in computer graphics for various applications:
Interactive Graphics: Windowing and clipping are used in interactive graphics applications to manage the viewing area and update the scene as the user navigates or interacts with objects.
3D Modeling and Rendering: Windowing and clipping are used to render 3D objects in a controlled manner, ensuring that only the visible portions are displayed and reducing rendering time.
Medical Imaging: Windowing and clipping are used in medical imaging to focus on specific regions of interest, such as organs or lesions, within medical scans.
Video Editing: Windowing and clipping are used in video editing to define the visible area of the video frame and remove unwanted elements from the scene.
Graphical User Interfaces (GUIs): Windowing and clipping are used to manage the layout and visibility of elements within GUIs, ensuring that only relevant information is displayed within the window boundaries.
Windowing and clipping are fundamental tools in computer graphics, providing efficient methods for managing the viewing area, optimizing rendering performance, and enhancing visual quality. Their versatility and adaptability make them essential for a wide range of graphic applications.
Segments
The term “segments” can refer to various concepts depending on the context. Here are a few possible interpretations:
Geometry:
In geometry, a segment is a portion of a line bounded by two distinct endpoints. It represents a continuous part of a line, extending indefinitely in both directions. Segments are often used to define the boundaries of shapes and to analyze their properties.
Computer Graphics:
In computer graphics, a segment is a line segment that is discretized into a series of pixels for representation on a display screen. It is the fundamental building block for rendering lines, curves, and other graphical elements. Segments are defined by their endpoints, which are specified by their x and y coordinates.
Image Processing:
In image processing, segments refer to regions of an image that share similar characteristics, such as color, texture, or intensity. They are often used for image segmentation, a technique that aims to partition an image into meaningful segments or objects. Segmenting an image can facilitate object recognition, feature extraction, and content analysis.
Data Analysis:
In data analysis, segments can refer to portions of a time series or a sequence of data. They are often used for data segmentation, a technique that aims to divide a data set into meaningful segments based on patterns, trends, or changes in the data. Segmenting data can facilitate data exploration, anomaly detection, and predictive modeling.
Networking:
In networking, segments refer to portions of a network that are separated by routers or switches. They are often used to isolate broadcast domains and improve network performance. Segments can also be used to implement security measures by restricting access to specific network segments.
These are just a few examples of how the term “segments” is used in various fields. The specific meaning depends on the context and the discipline in which it is used.
Interactive picture construction techniques
Interactive picture construction techniques are a set of methods used to create and manipulate graphical elements in real-time. These techniques are essential for creating interactive graphics applications, such as drawing programs, computer-aided design (CAD) software, and video games.
Common Interactive Picture Construction Techniques
Positioning and Pointing: These techniques allow users to position objects on the screen using pointing devices such as a mouse or touch screen. Simple positioning involves dragging and dropping objects, while more precise positioning may involve snapping objects to grid lines or guides.
Constraints: Constraints are rules that restrict the movement or behavior of objects. They can be used to ensure that objects align correctly, maintain specific relationships, or follow predefined paths.
Rubber Band Method: The rubber band method is used to create and modify lines and curves in real-time. It involves anchoring one end of a line or curve and dragging the other end to define its shape.
Inking: Inking techniques are used to draw and edit strokes, such as lines, curves, and shapes. They can be used to create freehand drawings, trace existing objects, or apply specific drawing styles.
Sketching: Sketching techniques provide tools for creating quick, loose drawings. They often allow for more gestural and expressive drawings, capturing the essence of an object or idea.
Selection and Manipulation: Selection techniques allow users to identify and isolate specific objects or elements within a graphical scene. Once selected, objects can be manipulated using various techniques, such as resizing, rotating, or duplicating.
Undo/Redo: Undo and redo functionality is essential for interactive picture construction, allowing users to reverse or restore actions without losing their work. This provides flexibility and encourages experimentation.
Gesture Recognition: Gesture recognition techniques enable users to interact with graphical elements using natural gestures, such as hand movements or voice commands. This can provide a more intuitive and immersive interactive experience.
Applications of Interactive Picture Construction Techniques
Interactive picture construction techniques are used in a wide range of applications, including:
Drawing Programs: Interactive drawing programs, such as Adobe Illustrator and Procreate, utilize these techniques to allow users to create and edit vector graphics in real-time.
Computer-Aided Design (CAD) Software: CAD software, such as AutoCAD and SolidWorks, employs these techniques for precise object placement, dimensioning, and manipulation in 2D and 3D environments.
Video Games: Interactive picture construction techniques are essential for creating interactive game elements, such as character movement, object manipulation, and user interface interactions.
Animation Software: Animation software, such as Adobe Animate and Toon Boom Harmony, uses these techniques to create and manipulate animated scenes, including character rigging, lip-syncing, and special effects.
Presentation Software: Presentation software, such as Microsoft PowerPoint and Prezi, incorporates these techniques for creating interactive presentations with real-time manipulation of slides, graphics, and animations.
Interactive Art and Installations: Interactive art installations often employ these techniques to create immersive and responsive experiences that engage viewers and generate dynamic visuals.
Interactive picture construction techniques are fundamental tools for creating interactive graphics applications, providing users with the ability to create, manipulate, and control graphical elements in real-time. Their versatility and adaptability make them essential for a wide range of graphic applications, from artistic expression and design to interactive entertainment and education.
Interactive input and output Devices
Interactive input and output devices are essential components of human-computer interaction (HCI), enabling users to communicate with computers and experience dynamic and responsive interactions. These devices allow users to input information, receive feedback, and control various aspects of the computing environment.
Types of Interactive Input Devices
Keyboard: The keyboard is a standard input device for entering text, numbers, and symbols. It consists of an arrangement of keys that correspond to specific characters or actions.
Mouse: The mouse is a pointing device used to control the cursor on the screen and interact with graphical elements. It typically has two or three buttons for selecting, clicking, and dragging objects.
Touchpad: The touchpad is a pressure-sensitive surface that mimics the functionality of a mouse. It is commonly found on laptops and mobile devices, providing a convenient input method without the need for an external mouse.
Touchscreen: A touchscreen is a display screen that senses touch gestures, allowing users to interact directly with the screen. It is widely used in smartphones, tablets, and interactive kiosks.
Joystick: A joystick is a lever-controlled device used for controlling movement and direction, particularly in games and flight simulators.
Stylus: A stylus is a pen-shaped input device used for writing, drawing, and precision tasks on touchscreens or digitizing tablets.
Microphone: A microphone is an audio input device that captures sound waves and converts them into electrical signals for speech recognition, voice commands, and recording purposes.
Webcam: A webcam is a video input device that captures images and video streams, enabling video conferencing, virtual reality experiences, and augmented reality applications.
Types of Interactive Output Devices
Monitor: A monitor is a display device that presents visual information, such as text, graphics, and video, to the user. It typically consists of a screen, backlight, and control panel.
Printer: A printer is an output device that produces physical copies of digital documents or images onto paper. Printers come in various types, including inkjet, laser, and thermal printers.
Speaker: Speakers are audio output devices that convert electrical signals into sound waves, allowing users to hear audio content, such as music, speech, and system sounds.
Projector: A projector is a device that enlarges and projects images onto a screen or wall. It is commonly used for presentations, conferences, and home theater setups.
Haptic Devices: Haptic devices provide tactile feedback, allowing users to sense vibrations, forces, and textures through touch. They are used in virtual reality, robotics, and interactive gaming applications.
Applications of Interactive Input and Output Devices
Interactive input and output devices are ubiquitous in modern computing, enabling a wide range of applications:
Personal Computers: Desktop and laptop computers rely on keyboards, mice, touchpads, and monitors for user input and output.
Mobile Devices: Smartphones and tablets utilize touchscreens, microphones, speakers, and displays for interactive interactions.
Gaming Consoles: Gaming consoles employ joysticks, controllers, and motion sensors for immersive gaming experiences.
Virtual and Augmented Reality: Headsets and gloves equipped with sensors enable real-time interaction in virtual environments.
Medical Devices: Interactive input and output devices are used in medical equipment for patient monitoring, surgical procedures, and diagnostic imaging.
Industrial Automation: Sensors, actuators, and control panels facilitate human-machine interaction in manufacturing and industrial settings.
Educational Technology: Interactive whiteboards, touchscreens, and tablets enhance learning experiences in classrooms and educational settings.
Interactive input and output devices are constantly evolving, with advancements in technology leading to more sophisticated and responsive interactions. These devices play a crucial role in shaping the future of computing, enabling seamless communication between humans and machines.
UNIT: 4
Three–dimensional
Three-dimensional (3D) refers to objects or representations that have three dimensions: length, width, and height. They exist in space and have depth or thickness, unlike two-dimensional (2D) objects, which only have length and width. 3D concepts and objects are fundamental in various fields, including mathematics, physics, engineering, computer graphics, and art.
Properties of Three-Dimensional Objects
Volume: 3D objects have a measurable volume, which is the extent of the space they occupy. It is calculated in cubic units, such as cubic meters or cubic centimeters.
Surface Area: 3D objects have a measurable surface area, which is the total area of all their exterior surfaces. It is calculated in square units, such as square meters or square centimeters.
Depth Perception: Humans perceive depth using binocular vision, where our two eyes see slightly different perspectives of the scene. This allows us to judge distances and understand the spatial relationships between objects.
Examples of Three-Dimensional Objects
Shapes: Basic shapes like spheres, cubes, cones, and cylinders are all three-dimensional.
Objects in the Real World: Everything around us, from buildings and trees to animals and people, exists in three dimensions.
3D Models: 3D models are digital representations of three-dimensional objects, commonly used in computer graphics, engineering, and design.
Sculptures: Sculptures are three-dimensional artworks created by shaping materials like wood, stone, or metal.
Architectural Structures: Buildings, bridges, and other architectural structures are three-dimensional constructions.
Applications of Three-Dimensional Concepts
Geometry: 3D geometry studies the properties, relationships, and measurements of three-dimensional shapes.
Physics: 3D concepts are fundamental in physics for understanding forces, motion, and the behavior of matter in space.
Engineering: 3D modeling and simulation are essential in engineering for designing structures, analyzing stresses, and optimizing performance.
Computer Graphics: 3D graphics are used to create realistic and immersive images, animations, and virtual environments.
Medical Imaging: 3D imaging techniques, such as MRI and CT scans, provide detailed views of the internal anatomy of the human body.
Virtual Reality (VR): VR immerses users in simulated three-dimensional environments, providing interactive experiences.
Augmented Reality (AR): AR overlays digital information onto the real world, blending the physical and virtual worlds.
Three-dimensional concepts and objects play a crucial role in various fields, providing a framework for understanding spatial relationships, designing objects, and creating realistic representations. Their versatility and applicability make them essential for a wide range of applications, shaping the way we interact with the world around us.
Three- Dimensional concepts
Three-dimensional concepts encompass the fundamental principles and ideas related to the existence and representation of objects or shapes in three-dimensional space. These concepts are essential for understanding the physical world around us, engaging in various scientific and engineering disciplines, and creating realistic and immersive experiences in computer graphics and virtual environments.
Core Concepts in Three-Dimensional Space
Dimensions: Three-dimensional objects possess three distinct dimensions: length, width, and height. These dimensions allow us to describe the spatial extent and relationships between objects in space.
Volume: Three-dimensional objects have a measurable volume, which represents the amount of space they occupy. Volume is calculated in cubic units, such as cubic meters or cubic centimeters.
Surface Area: Three-dimensional objects have a measurable surface area, which represents the total area of all their exterior surfaces. Surface area is calculated in square units, such as square meters or square centimeters.
Coordinates: Three-dimensional coordinates provide a system for identifying and locating points in space. Common coordinate systems include Cartesian coordinates, cylindrical coordinates, and spherical coordinates.
Transformations: Three-dimensional transformations involve manipulating objects in space, such as translation, rotation, scaling, and reflection. These transformations are fundamental in computer graphics and animation.
Perspective: Perspective is the phenomenon of objects appearing to change in size and shape depending on their distance from the observer. Understanding perspective is crucial for creating realistic images and scenes.
Lighting and Shadows: Lighting and shadows play a significant role in shaping the perception of three-dimensional objects. Understanding light sources, their interactions with objects, and the formation of shadows is essential for creating realistic and visually appealing representations.
Applications of Three-Dimensional Concepts
Three-dimensional concepts are widely applicable in various fields, including:
Mathematics: Three-dimensional geometry is a branch of mathematics that studies the properties, relationships, and measurements of three-dimensional shapes.
Physics: Three-dimensional concepts are fundamental in physics for understanding forces, motion, and the behavior of matter in space.
Engineering: Three-dimensional modeling and simulation are essential in engineering for designing structures, analyzing stresses, and optimizing performance.
Architecture and Design: Three-dimensional concepts are used in architecture and design to create blueprints, models, and visualizations of buildings, interiors, and products.
Computer Graphics: Three-dimensional graphics are used to create realistic and immersive images, animations, and virtual environments.
Medical Imaging: Three-dimensional imaging techniques, such as MRI and CT scans, provide detailed views of the internal anatomy of the human body.
Virtual Reality (VR): VR immerses users in simulated three-dimensional environments, providing interactive experiences.
Augmented Reality (AR): AR overlays digital information onto the real world, blending the physical and virtual worlds.
Three-dimensional concepts provide a framework for understanding the physical world around us, designing objects, and creating realistic representations. Their versatility and applicability make them essential for a wide range of applications, shaping the way we interact with the world around us and the digital realm.
3-D representation and transformation
import numpy as np
# Define the framebuffer size
width = 640
height = 480
# Create a framebuffer with a white background
framebuffer = np.ones((height, width, 3), dtype=np.uint8) * 255
# Define the center of the object
center_x = width // 2
center_y = height // 2
# Define the radius of the object
radius = 100
# Define the color of the object
color = (255, 0, 0)
# Translation
def translate(x, y, dx, dy):
return x + dx, y + dy
# Translation example
translated_x, translated_y = translate(center_x, center_y, 50, 50)
# Draw a circle at the translated coordinates
for x in range(width):
for y in range(height):
distance = np.sqrt((x – translated_x)**2 + (y – translated_y)**2)
if distance <= radius:
framebuffer[y, x] = color
# Rotation
def rotate(x, y, angle):
angle_radians = np.deg2rad(angle)
cos_theta = np.cos(angle_radians)
sin_theta = np.sin(angle_radians)
rotated_x = x * cos_theta – y * sin_theta
rotated_y = x * sin_theta + y * cos_theta
return rotated_x, rotated_y
# Rotation example
rotated_x, rotated_y = rotate(center_x, center_y, 45)
# Draw a circle at the rotated coordinates
for x in range(width):
for y in range(height):
distance = np.sqrt((x – rotated_x)**2 + (y – rotated_y)**2)
if distance <= radius:
framebuffer[y, x] = color
# Scaling
def scale(x, y, sx, sy):
scaled_x = x * sx
scaled_y = y * sy
return scaled_x, scaled_y
# Scaling example
scaled_x, scaled_y = scale(center_x, center_y, 0.5, 0.5)
# Draw a circle at the scaled coordinates
for x in range(width):
for y in range(height):
distance = np.sqrt((x – scaled_x)**2 + (y – scaled_y)**2)
if distance <= radius:
framebuffer[y, x] = color
# Display the framebuffer
import matplotlib.pyplot as plt
plt.imshow(framebuffer)
plt.show()
3-D viewing
3-D viewing refers to the techniques and methods used to represent and display three-dimensional objects on a two-dimensional screen or display device. This involves transforming the 3D coordinates of objects into 2D coordinates that can be rendered on the screen. Several techniques are employed to achieve realistic and immersive 3D viewing experiences.
Core Techniques in 3D Viewing
Projection: Projection is the process of transforming 3D coordinates into 2D coordinates. Two common types of projection are:
Perspective Projection: Perspective projection simulates the way the human eye perceives objects, making distant objects appear smaller and closer objects appear larger.
Orthographic Projection: Orthographic projection projects objects onto a plane perpendicular to their direction. It preserves the relative sizes and shapes of objects, making it useful for technical drawings and architectural plans.
Clipping: Clipping is the process of removing portions of objects that fall outside the viewing area. This is done to improve rendering efficiency and prevent objects from extending beyond the display boundaries.
Hidden Surface Removal: Hidden surface removal determines which parts of an object are visible from the viewer’s perspective and which are hidden behind other objects. This is essential for creating realistic images and preventing objects from occluding each other.
Shading and Lighting: Shading and lighting techniques are used to simulate the effects of light on objects, creating depth and realism. Common shading models include:
Ambient Shading: Ambient shading provides a uniform lighting level across the entire object.
Diffuse Shading: Diffuse shading simulates the scattering of light from a surface, making it appear brighter in areas facing the light source and dimmer in areas facing away.
Specular Shading: Specular shading simulates the reflection of light from a surface, creating highlights and shiny reflections.
Texturing: Texturing maps images onto surfaces of objects, adding detail, realism, and visual interest. Textures can represent various materials, patterns, and surface characteristics.
Applications of 3D Viewing
3D viewing techniques have a wide range of applications in various fields:
Computer Graphics: 3D viewing is fundamental in computer graphics for creating realistic and immersive images, animations, and virtual environments. It is used in various industries, including gaming, film, television, and architecture.
Medical Imaging: 3D viewing techniques are used to visualize and analyze medical scans, such as MRI and CT scans, providing doctors with detailed views of internal anatomy and potential abnormalities.
Scientific Visualization: 3D viewing is used to visualize complex scientific data, such as molecular structures, weather patterns, and fluid dynamics, helping scientists understand and communicate their findings.
Engineering Design and Simulation: 3D viewing is used in engineering design and simulation to create 3D models of products, structures, and machinery, allowing engineers to visualize, test, and optimize their designs before physical prototypes are created.
Virtual Reality (VR) and Augmented Reality (AR): 3D viewing is essential for creating immersive and realistic VR and AR experiences, allowing users to interact with virtual objects and environments in a natural and intuitive way.
Education and Training: 3D viewing can enhance education and training by providing interactive and immersive 3D visualizations of concepts and procedures, making learning more engaging and effective.
3D viewing techniques continue to evolve with advancements in technology, leading to more realistic, immersive, and interactive experiences. These techniques play a crucial role in various fields, providing powerful tools for visualization, communication, and design.
Algorithms for 3-D volumes spline curves and surfaces
3-D Volumes
3D volumes represent objects in three-dimensional space, encompassing both their shape and interior properties. Several algorithms are used to process and analyze 3D volumes, including:
Marching Cubes: Marching cubes is a popular algorithm for extracting isosurfaces from a 3D volume. It works by evaluating the voxel values at the corners of a cube and interpolating between them to determine the surface geometry.
Marching Tetrahedra: Marching tetrahedra is an extension of marching cubes that uses tetrahedra instead of cubes as the basic building blocks. It can handle more complex geometries and produce smoother surfaces.
Voxel-Based Rendering: Voxel-based rendering directly manipulates voxel data to create images of 3D volumes. It is often used for medical imaging and scientific visualization.
Spline Curves
Spline curves are parametric curves that are defined by a set of control points and a blending function that interpolates between them. They are widely used in computer graphics for creating smooth and flexible curves. Common spline curve algorithms include:
Bézier Curves: Bézier curves use a polynomial blending function and are known for their ease of calculation and control over the curve shape.
B-Spline Curves: B-spline curves use a piecewise polynomial blending function and provide more flexibility and local control over the curve shape.
Non-Uniform Rational B-Splines (NURBS): NURBS are an extension of B-spline curves that introduce weights to the control points, allowing for more precise control over the curve shape and smoothness.
Spline Surfaces
Spline surfaces are extensions of spline curves that extend the concept of parametric curves to three dimensions. They are used to represent complex shapes and surfaces in computer graphics and other fields. Common spline surface algorithms include:
Bézier Surfaces: Bézier surfaces are defined by a grid of control points and use a tensor product of Bézier curves to generate the surface shape.
B-Spline Surfaces: B-spline surfaces are defined by a grid of control points and use a tensor product of B-spline curves to generate the surface shape.
Non-Uniform Rational B-Splines (NURBS) Surfaces: NURBS surfaces are an extension of B-spline surfaces that introduce weights to the control points, allowing for more precise control over the surface shape and smoothness.
These algorithms provide powerful tools for representing, manipulating, and visualizing 3D objects in various fields, including computer graphics, engineering, medical imaging, and scientific visualization.
Unit-5
Animation
Animation is the art of creating the illusion of movement by rapidly displaying a sequence of still images. It is a versatile and powerful medium that can be used to entertain, inform, and educate. Animation is used in a wide variety of applications, including film, television, video games, and web design.
Types of Animation
There are many different types of animation, but they can be broadly categorized into two main types:
Traditional Animation:
This is the oldest form of animation, and it involves hand-drawing or painting each frame of the animation. This is a very time-consuming process, but it can produce very beautiful and expressive results.
Computer Animation:
This type of animation uses computers to create the animation. This can be done in a number of ways, including 2D animation, 3D animation, and stop-motion animation. Computer animation is much faster to create than traditional animation, and it can be used to create a wide variety of effects.
Common Animation Techniques
There are a number of common animation techniques that are used to create the illusion of movement. These include:
Frame Rate:
The frame rate is the number of frames that are displayed per second. The higher the frame rate, the smoother the animation will appear. The standard frame rate for animation is 24 frames per second.
Persistence of Vision:
This is a human perceptual phenomenon that allows us to see a series of still images as a continuous motion. This is because our brains retain an image for a short period of time after it has been seen.
Exposure Blending:
This technique is used to create the illusion of movement by blending together two or more images. This is often used in animation to create smooth transitions between frames.
Motion Blur:
This technique is used to simulate the blurring of objects in motion. This is done by adding a blur to the edges of moving objects.
Animation Software
There are many different animation software programs available, each with its own strengths and weaknesses. Some popular animation software programs include:
Adobe Animate: This is a powerful and versatile animation software program that can be used to create both 2D and 3D animation.
Toon Boom Harmony: This is a professional animation software program that is widely used in the animation industry.
Blender: This is a free and open-source animation software program that can be used to create 3D animation.
Animation is a constantly evolving art form, and new techniques and technologies are being developed all the time. This makes it an exciting and challenging field to be a part of Animation.
Tweeking
Tweeking is the process of making small, incremental changes to parameters or control points within a graphical element or animation. It’s a precise and iterative process that allows artists and animators to refine the details and nuances of their work.
Common applications of tweaking include:
Adjusting facial expressions: In character animation, tweaking facial control points can produce subtle changes in facial expressions, conveying emotions and enhancing realism.
Refining motion paths: In animation, tweaking keyframes and motion paths can fine-tune the movement of objects, ensuring smooth transitions and realistic timing.
Optimizing lighting and shading: In 3D rendering, tweaking lighting parameters and shading settings can control the appearance of objects, creating depth, realism, and visual appeal.
Modifying textures and materials: In 2D and 3D graphics, tweaking texture properties and material settings can enhance the visual quality of objects, making them appear more realistic and visually appealing.
Refining user interface elements: In graphic design and user interface (UI) development, tweaking the size, color, and placement of UI elements can improve usability, aesthetics, and overall user experience.
Tweeking is an essential tool for artists, animators, and designers, allowing them to meticulously refine their creations and achieve the desired visual effects. It’s a crucial step in the creative process, ensuring that the final product is polished, detailed, and visually appealing.
Morphing
Also known as image blending or shape interpolation, is a computer graphics technique that seamlessly transitions between two or more images or shapes. It creates the illusion of one image or shape transforming into another, producing a smooth and dynamic visual effect.
Common Applications of Morphing
Special Effects in Film and Television: Morphing is widely used in film and television to create impressive special effects, such as transforming characters, merging objects, and creating otherworldly transitions.
Facial Expressions and Character Animation: Morphing can be used to animate facial expressions and create convincing transitions between different emotions or character expressions.
Transition Effects in Multimedia and Presentations: Morphing is often used to create smooth and visually appealing transitions between slides, images, or video clips in multimedia presentations and websites.
Logo Transformations and Brand Identity: Morphing can be used to create dynamic and memorable logo animations, emphasizing brand identity and visual appeal.
Data Visualization and Morphing Charts: Morphing can be used to visualize data changes over time, creating dynamic charts and graphs that effectively convey trends and patterns.
Educational and Interactive Applications: Morphing can be used in educational software and interactive applications to create engaging and interactive learning experiences.
Art and Creative Expression: Morphing can be used as an artistic tool to create surreal and transformative imagery, exploring visual concepts and narratives.
Web Animation and User Interfaces: Morphing can be used to create interactive web animations and user interfaces, enhancing the user experience and adding visual interest.
Video Editing and Special Effects: Morphing is a common tool in video editing to create smooth transitions between scenes, add visual effects, and enhance the overall production value.
Computer Graphics Research and Applications: Morphing techniques continue to evolve and are actively researched in computer graphics, leading to more sophisticated and realistic effects.
Morphing is a versatile and powerful technique that has become an integral part of computer graphics and image processing. Its ability to create seamless transitions and transformations makes it a valuable tool for various applications, from filmmaking and animation to data visualization and interactive design.
Introduction to GKS primitive
The Graphical Kernel System (GKS) is a standardized interface for 2D graphics programming. It defines a set of primitive functions that can be used to draw basic graphical elements such as lines, circles, text, and filled areas. These primitives are device-independent, meaning that they can be used to draw graphics on a variety of devices, such as monitors, printers, and plotters.
Basic GKS Primitives
Polyline: The polyline primitive draws a sequence of connected line segments. It is specified by a list of points, where each point represents the coordinates of a vertex.
Polymarker: The polymarker primitive draws a sequence of markers at specified locations. The marker type can be chosen from a variety of options, such as circles, squares, and triangles.
Fill Area: The fill area primitive fills an enclosed region with a specified color. It is specified by a closed polyline or a list of points that define the boundary of the region.
Text: The text primitive draws text at a specified location and orientation. The text string, font, and text color can be specified.
Cell Array: The cell array primitive is a more sophisticated primitive that allows for drawing complex shapes and patterns. It is specified by a grid of cells, where each cell can have a different color or pattern.
Additional GKS Features
GKS provides a number of additional features, such as:
Attributes: Attributes can be used to control the appearance of graphical elements, such as line width, line color, fill color, and text size.
Transformations: Transformations can be used to manipulate graphical elements, such as translation, rotation, and scaling.
Clipping: Clipping can be used to hide portions of graphical elements that fall outside the viewing area.
Inking: Inking can be used to create smooth and continuous lines from a series of connected points.
Benefits of Using GKS Primitives
There are several benefits to using GKS primitives:
Device Independence: GKS primitives are device-independent, so they can be used to draw graphics on a variety of devices.
Portability: GKS is a standardized interface, so programs that use GKS primitives can be easily ported to different platforms.
Efficiency: GKS primitives are designed to be efficient, so they can be used to draw graphics quickly.
Ease of Use: GKS primitives are relatively easy to use, so they can be learned quickly by new programmers.
Applications of GKS Primitives
GKS primitives are used in a wide variety of applications, such as:
Computer-Aided Design (CAD): GKS primitives are used to draw the components of CAD drawings.
Scientific Visualization: GKS primitives are used to visualize scientific data.
Business Graphics: GKS primitives are used to create charts and graphs.
User Interfaces: GKS primitives are used to draw the elements of user interfaces.
Games: GKS primitives are used to draw the graphics of games.
GKS primitives are a powerful and versatile tool for 2D graphics programming. They are easy to use, efficient, and portable, and they can be used to draw a wide variety of graphical elements.
Multimedia application
A multimedia application is a software program that combines various media formats, such as text, audio, video, graphics, and animation, to deliver an interactive and engaging user experience. Multimedia applications are widely used in various fields, including education, entertainment, business, and scientific visualization.
Characteristics of Multimedia Applications
Integration of Multiple Media: Multimedia applications combine different media elements to create a rich and immersive user experience.
Interactivity: Multimedia applications often incorporate interactive elements, allowing users to control the flow of content and engage with the application in a dynamic way.
Hypermedia: Multimedia applications often employ hypermedia links, enabling users to navigate between different sections of content or access additional resources.
Non-Linear Presentation: Multimedia applications can present information in a non-linear fashion, allowing users to explore content at their own pace and in a personalized manner.
Types of Multimedia Applications
Educational Multimedia: Educational multimedia applications are designed to enhance the learning process by integrating multimedia elements into educational content. They can be used for self-paced learning, online courses, and interactive simulations.
Entertainment Multimedia: Entertainment multimedia applications are designed to provide entertainment and enjoyment to users. They include video games, interactive movies, virtual reality experiences, and music production software.
Business Multimedia: Business multimedia applications are used to enhance communication, collaboration, and decision-making within organizations. They include presentation software, video conferencing tools, and interactive dashboards.
Scientific Visualization: Scientific visualization applications use multimedia techniques to represent and analyze scientific data. They can be used to create 3D models, simulations, and interactive visualizations of complex data sets.
Examples of Multimedia Applications
Educational Multimedia:
Khan Academy
Duolingo
Minecraft Education Edition
Entertainment Multimedia:
Fortnite
The Sims 4
Netflix
Business Multimedia:
Microsoft PowerPoint
Zoom Cloud Meetings
Tableau
Scientific Visualization:
VMD
ParaView
Maya
Impact of Multimedia Applications
Multimedia applications have significantly impacted various aspects of society:
Education: Multimedia applications have revolutionized education by providing interactive and engaging learning experiences.
Entertainment: Multimedia applications have transformed the entertainment industry, offering a wide range of immersive and interactive experiences.
Business: Multimedia applications have enhanced communication, collaboration, and decision-making in businesses.
Scientific Research: Multimedia applications have facilitated scientific visualization and data analysis, leading to new discoveries and advancements.
Technology and Innovation: Multimedia applications have driven advancements in computer graphics, artificial intelligence, and user interface design.
Multimedia applications continue to evolve, incorporating new technologies and media formats to create increasingly sophisticated and engaging user experiences. Their impact on various fields is undeniable, and they will continue to play a significant role in shaping the future of technology and society.